Sometimes, the decoding accuracy of MVPA may lower than chance level, which is confusing. I have found several reasons that may lead to below-chance accuracy in decoding analysis.
- special data structure (bias)
- model parameters (linear vs. non linear)
- cross validation methods (leave-one-out vs. k-fold)
- sample size (small vs. large)
In short, below-chance accuracy is likely caused by data structure and decoding methods, which can not be simply interpreted as anti-learning.
For example, when training with totally random data, the decoding accuracy should fluctuate at the chance level (50%), but actually it may lower than 50%.
library("ggplot2")
library("dplyr")
library("e1071")
# --------training function ---------
f_train <- function(n, s = 1,
                    r = F, c = n) {
  # nv: number of features
  nv <- 2
  # n: number of observations
  set.seed(s)
  # generate random data
  rNum <- rnorm(nv * n)
  rNum <- matrix(rNum, n, nv)
  d <- as.data.frame(rNum)

  # generate random labels
  n2 <- n / 2
  labels <- c(array(1, n2),
              array(2, n2))
  if (r) {
  labels <- sample.int(2,n,replace=T)}
  else {
  labels <-  sample(labels)}
  d$condition <- factor(labels)

  # training
  m_trained <- svm(condition ~ .,
    data = d,
    cross = c,
    # cross = nrow(d), # leave one out
    kernel = "linear",
    cost = 1
  )
  # get CV
  acc <- m_trained$tot.accuracy
}
# no replacement, leave one out
p <- expand.grid(iTest = 1:200,
n = seq(10, 210, 50))
data_test <- p %>%
group_by(iTest, n) %>%
do(data.frame(acc = f_train(.$n,.$iTest)))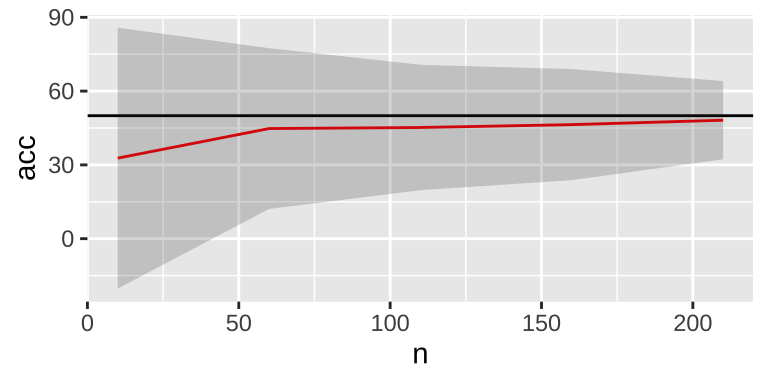
As the sample size increases, variability decreases, and the mean accuracy tends to be 50%. However, there is a persistent small down bias on average, which can be eliminated using sampling with replacement.
# with replacement, leave one out
data_test <- p %>%
  group_by(iTest, n) %>%
  do(data.frame(acc = f_train(.$n,.$iTest,
                              r = T)))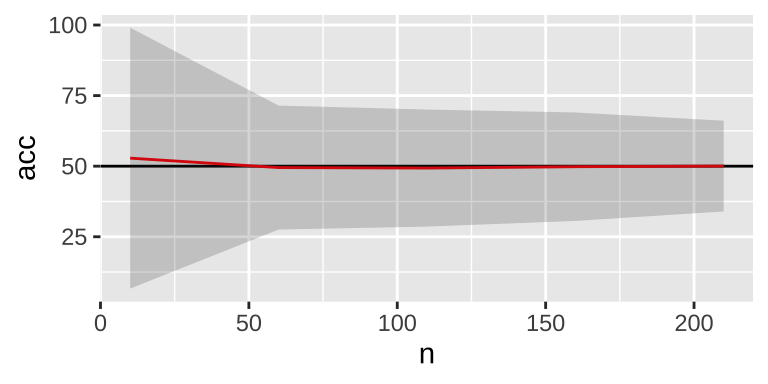
In addition, change to 10-fold cross validation may also decrease the variability.
# with replacement, 10-fold cross validation
data_test <- p %>%
  group_by(iTest, n) %>%
  do(data.frame(acc = f_train(.$n,.$iTest,
                              r = F, c=10)))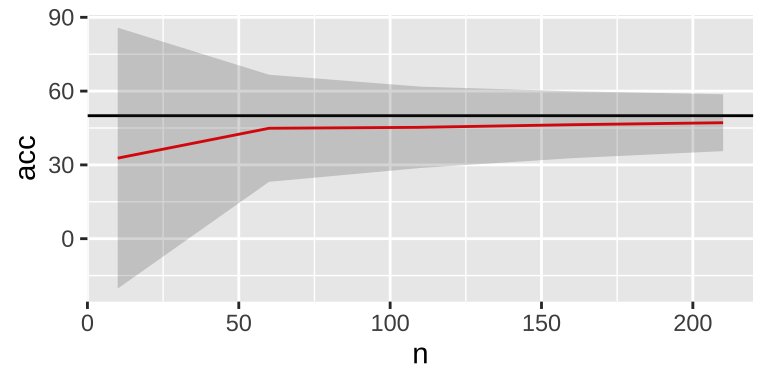
Some references:
- The same analysis approach: Practical protection against the pitfalls of novel neuroimaging analysis methods
- How to control for confounds in decoding analyses of neuroimaging data
- Classification Based Hypothesis Testing in Neuroscience: Below-Chance Level Classification Rates and Overlooked Statistical Properties of Linear Parametric Classifiers
- Multivariate classification of neuroimaging data with nested subclasses: Biased accuracy and implications for hypothesis testing
- Deconstructing multivariate decoding for the study of brain function