R Markdown
This is an R Markdown document. Markdown is a simple formatting syntax for authoring HTML, PDF, and MS Word documents. For more details on using R Markdown see http://rmarkdown.rstudio.com.
You can embed an R code chunk like this:
summary(cars)
##      speed           dist
##  Min.   : 4.0   Min.   :  2.00
##  1st Qu.:12.0   1st Qu.: 26.00
##  Median :15.0   Median : 36.00
##  Mean   :15.4   Mean   : 42.98
##  3rd Qu.:19.0   3rd Qu.: 56.00
##  Max.   :25.0   Max.   :120.00
fit <- lm(dist ~ speed, data = cars)
fit
##
## Call:
## lm(formula = dist ~ speed, data = cars)
##
## Coefficients:
## (Intercept)        speed
##     -17.579        3.932
Codes are highlighted by Highlight.js. The theme and language of Highlight.js can be changed in config.toml. The exact name of theme and language can be found in the GitHub repository.
# options for highlight.js (version, additional languages, and theme)
highlightjsVersion = "10.5.0"
highlightjsCDN = "//cdnjs.cloudflare.com/ajax/libs"
highlightjsLang = ["r", "yaml","matlab"]
highlightjsTheme = "atom-one-dark-reasonable"
Including Plots
You can also embed plots. See Figure 1 for example:
The width of the plot can be set by fig.width, but the output width of it should be set by out.width, e.g. out.width='100%'.
par(mar = c(0, 1, 0, 1))
pie(
  c(280, 60, 20),
  c('Sky', 'Sunny side of pyramid', 'Shady side of pyramid'),
  col = c('#0292D8', '#F7EA39', '#C4B632'),
  init.angle = -50, border = NA
)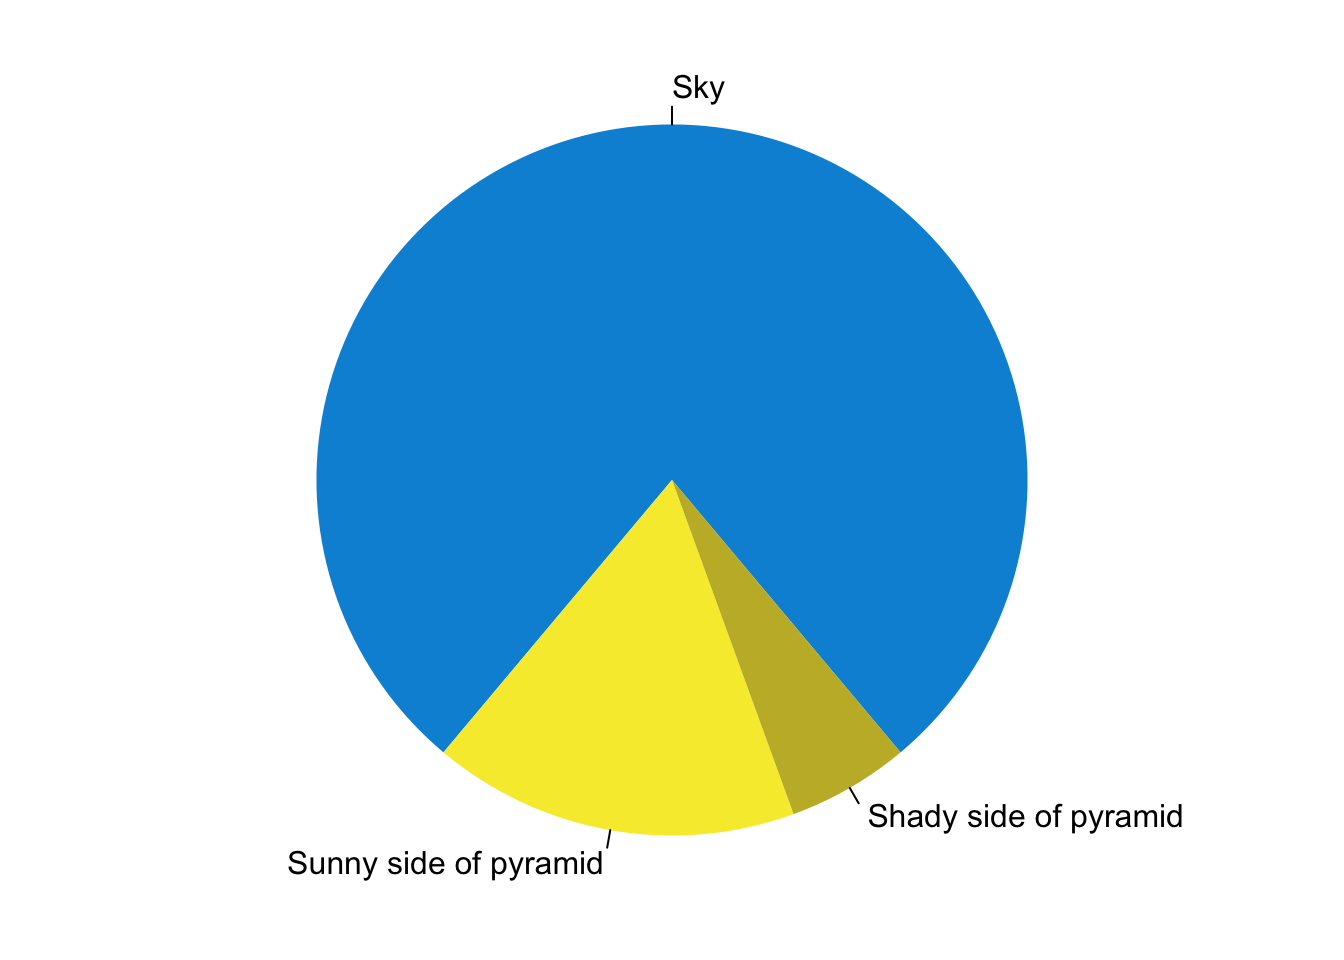
Figure 1: A fancy pie chart.